Common Show ROI measurement Mistakes International Wine Brands Should Avoid
Discover the critical trade show ROI measurement mistakes international wine brands make, from premature conversion windows to ignoring compliance and sampling costs.
International wine brands routinely allocate tens of thousands of dollars to exhibit at major global beverage expos. Yet, an overwhelming majority calculate their trade show return on investment (ROI) using flawed formulas, arbitrary attribution windows, or vanity engagement statistics. Wine trade shows are not transactional retail pop-ups; they are long-cycle B2B distribution negotiations governed by customs clearance, import licenses, minimum order quantities (MOQs), and tiered distributor margins.
When winery executives evaluate trade fair success solely by the number of scanned badges or on-site order forms signed within 30 days, they misjudge their actual performance. By understanding and rectifying the most common show ROI measurement mistakes, wine producers can accurately assess their trade investments, defend their marketing budgets, and secure profitable, multi-year distribution contracts in high-growth markets like China and wider Asia.
1. Conflating Footfall and Badge Scans with Commercial Pipeline Value
A primary error wine exhibitors make is treating booth traffic and badge scans as direct indicators of commercial return. As trade marketing benchmarks from Catalyst Exhibits (2026) emphasize, exhibitors frequently try to reverse-engineer success from badge counts and a subjective feeling that a booth "felt busy," rather than defining quantitative lead qualification criteria before the show begins.
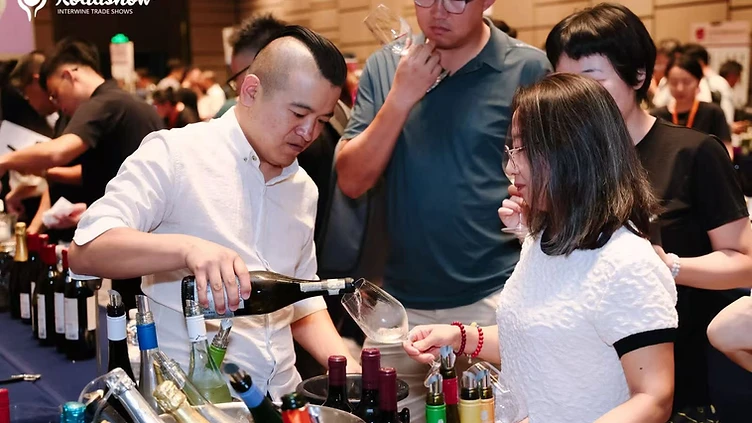
In the wine industry, raw footfall is particularly deceptive. Tasting booths inherently attract visitors who have no commercial authority—such as casual enthusiasts, junior hospitality staff, or competitors sampling vintages. When an export team logs 400 badge scans over three days, finance leaders often see high engagement. However, if only 12 of those contacts represent licensed beverage importers, provincial distributors, or key account retail buyers with allocated budgets, the true commercial yield is a fraction of the headline number.
The Corrective Metric: Qualified Pipeline Velocity
Wineries must separate general booth visitors from Marketing Qualified Leads (MQLs) and Sales Qualified Leads (SQLs):
- MQL (Wine Trade): A verified industry professional (sommelier, retail buyer, hospitality F&B manager) with purchase-influencing authority.
- SQL (Direct Distribution Partner): An importer, national distributor, or regional wholesaler with an active customs clearance code, proven cold-chain storage infrastructure, and an immediate requirement for your category or price point.
Evaluating your show based on qualified pipeline value rather than raw volume ensures that post-show forecasting reflects realistic commercial outcomes.
2. Using an Artificially Compressed Attribution Window
Many consumer goods companies measure event ROI across a 30-day or 60-day post-show cycle. In international wine distribution, applying a 30-day attribution window guarantees an inaccurate calculation. According to B2B event attribution research published by Vendelux (2026), one of the most common formula errors is tracking closed-won revenue against an immediate 30-day timeline rather than applying a realistic pipeline lag, such as 180 days.
International wine agreements require protracted negotiations:
- Sample Verification & Benchmarking: After the initial meeting, samples are evaluated by regional tasting panels and commercial sales teams.
- Regulatory & Compliance Filings: In regulated markets like China, importing wine requires back-label design approvals, Chinese customs registration (GACC requirements), certificate of origin verifications, and sanitary inspections.
- Commercial Structuring: Terms surrounding shipping (FOB vs. CIF), payment mechanisms (letters of credit, wire splits), currency fluctuation protections, and regional exclusivity clauses require multi-month reviews.
When wineries finalize their show accounting four weeks after the event, revenue is marked at zero while costs remain fully loaded, creating the illusion of an unprofitable exhibition. Realistically, wine contract lifecycles require a 180-to-360-day evaluation framework to capture initial container orders and scheduled re-orders.
3. Omitting the True "All-In" Cost of Exhibition Logistics
A standard formula for event ROI is: $$\text{ROI} = \frac{\text{Attributed Gross Margin} - \text{Total Investment}}{\text{Total Investment}} \times 100$$
However, wine brands frequently underreport their total investment by only factoring in raw booth space rental and airfare. Industry budgeting frameworks from Cvent (2025) note that comprehensive trade show ROI requires an exhaustive accounting of all-in costs—a principle that is doubly critical for alcohol brands dealing with heavy, perishable freight.
+--------------------------------------------------------------------------+
|                     True Total Cost of Exhibition (TCE)                  |
+--------------------------------------------------------------------------+
|  [Direct Show Costs]      [Logistics & Samples]    [Human Capital]       |
|  - Booth space rental     - Temperature-controlled - Travel & lodging    |
|  - Stand construction       freight                - Staff on-site hours |
|  - AV & glassware hire    - Customs duties/tariffs - Opportunity cost    |
|  - Official catalog ads   - Breakage & spoilage    - Translation/agency  |
+--------------------------------------------------------------------------+
Overlooked Wine Exhibition Cost Items:
- Customs Duties and Import Taxes: Shipping display and sample bottles overseas incurs non-recoverable tariffs, excise taxes, and port handling fees.
- Temperature-Controlled Logistics: High-end wine cannot travel via standard air or sea consolidated freight without risking heat damage. Reefer containers and specialized wine couriers add substantial overhead.
- Glassware, Ice, and Service Staff: Renting ISO tasting glasses, spittoons, ice buckets, and hiring bilingual booth translators are operational costs that directly erode margins.
- Pour Spoilage & Wastage: Bottled inventory opened for tasting represents inventory written down at production or wholesale cost.
Failing to incorporate these hidden logistics expenses inflates calculated ROI, masking inefficient operational choices.
4. Failing to Measure Customer Lifetime Value (LTV) and Depletions
A transaction-focused approach treats the first trial container order as the sole return generated by an exhibition. This ignores the commercial realities of the global wine trade, where opening orders are intentionally small to mitigate distributor risk.
A regional distributor might place an initial test order of three pallets (1,800 to 2,100 bottles) to gauge local market reception. If a winery measures ROI strictly on the gross margin of that opening order, the show may appear balance-sheet negative. However, if that same distributor re-orders a 20-foot container every quarter for the next three years, the multi-year Customer Lifetime Value (LTV) transforms that initial contact into a highly lucrative acquisition.
According to wine sampling and marketing analytics from ResearchAndMarkets.com (2021), structured experiential sampling must be linked to incremental, long-term brand revenue modeling rather than immediate checkout transactions. For premium wine brands, calculating ROI must combine opening contract margins with anticipated 12-to-24-month replenishment depletions.
5. Overlooking Return on Objectives (ROO) for Market Penetration
Pure financial ROI calculation assumes that cash flow is the only measure of success. For wineries entering a complex, high-entry-barrier market such as mainland China, an exclusive focus on short-term monetary ROI overlooks vital non-financial dividends known as Return on Objectives (ROO). As detailed by Team Tecna (2026), measuring ROO allows exhibitors to capture the strategic qualitative value of human interactions, partnership building, and brand positioning that ultimately drive future revenue.
When expanding internationally, meaningful ROO milestones include:
- Market Intelligence & Price Testing: Gathering direct feedback from experienced distributors regarding whether your retail shelf price, varietal blend, and packaging design resonate with local buying habits. Producers can access localized sector data via Market Insights.
- Competitive Benchmarking: Observing the pricing tiers, presentation formats, and promotional programs deployed by regional and global competitors in the Exhibitor Directory.
- Strategic Network Validation: Securing meetings with certified government associations, bonded logistics operators, and regional sommelier guilds.
Neglecting ROO leaves brand managers unable to justify the strategic value of initial market entry, leading many to exit promising export territories prematurely.
6. Neglecting Pre-Scheduled Business Matching Infrastructure
A critical operational mistake that damages ROI measurement is adopting a passive "wait-and-see" booth posture. Exhibitors who assemble a stand and simply wait for qualified buyers to walk by experience high variance in lead quality and low conversion rates.
High-performing wine brands protect their ROI before the event starts by utilizing structured Business Matching services. Setting pre-qualified, 1-on-1 meetings with vetted regional distributors and retail procurement managers ensures that at least 50% to 60% of on-site time is locked into high-intent discussions.
Tracking metrics from targeted pre-booked meetings gives commercial directors a concrete baseline to forecast pipeline value, moving the exhibition strategy away from luck and toward predictable B2B sales development.
A Pragmatic Framework for Measuring Wine Show Success
To prevent measurement distortion and prove trade show effectiveness to winery boards and finance directors, export executives should deploy a tiered evaluation framework:
| Timeline | Primary Metric | Commercial Focus | | :--- | :--- | :--- | During Show (Days 1–3) | Cost Per Qualified Lead (CPQL) | Tallying verified licensed importers, retail buyers, and regional distributors rather than total booth footfall. | | Post-Show (Days 30–60) | Engagement & Sample Progression Rate | Percentage of qualified contacts actively evaluating technical sheets, commercial price matrices, and secondary samples. | | Mid-Term (Day 180) | Pipeline Conversion Margin | Gross margin realized from confirmed opening orders, initial container shipments, and secured listing fees. | | Long-Term (Day 360+) | Net Account LTV & Re-order Rate | Compound margin calculated across sustained volume replenishment, regional expansion, and brand market share. |
By matching the measurement framework to the operational pace of the international wine sector, brands can identify high-performing trade venues, optimize logistics spending, and build durable global distribution partnerships.
If your winery is preparing its global market-entry strategy, you can Become an Exhibitor at upcoming sessions of INTERWINE to engage directly with qualified importers and national buyers across China.
Sources
- Cvent. (2025). How to Measure and Calculate Trade Show ROI. https://www.cvent.com/en/blog/events/trade-show-roi
- Catalyst Exhibits. (2026). How to Prove Trade Show ROI Before You Build the Booth. https://www.catalystexhibits.com/research-and-insights/trade-show-roi
- Vendelux. (2026). How to Measure Event Marketing ROI in 2026. https://vendelux.com/event-marketing/event-marketing-roi
- ResearchAndMarkets.com / Business Wire. (2021). Wine Event Sampling Experiential Marketing Benchmarks Report: Consumer Reach, Impact and ROI. https://www.businesswire.com/news/home/20210420005662/en/Wine-Event-Sampling-Experiential-Marketing-Benchmarks-Report-Consumer-Reach-Impact-and-ROI---ResearchAndMarkets.com
- Team Tecna. (2026). Trade Show ROI: How to Measure and Maximise Your Results? https://www.teamtecna.com/news-and-resources/trade-show-roi
Key Takeaways
- —Evaluating wine trade shows based solely on raw footfall or badge scans obscures commercial viability; brands must track Cost Per Qualified Lead (CPQL).
- —Measuring wine show ROI on a 30-day window is a fundamental error; international alcohol distribution contracts require a 180-to-360-day attribution lag.
- —True trade show expenditure must include specialized cold-chain freight, sample customs duties, import tariffs, glassware rentals, and poured inventory write-offs.
- —Long-term wine trade success relies on Customer Lifetime Value (LTV) and replenishment depletions, not just opening container volumes.
- —Return on Objectives (ROO)—such as market intelligence, price testing, and regulatory navigation—must supplement financial ROI in emerging wine markets.
- —Pre-scheduled business matching dramatically stabilizes lead quality, converting unpredictable booth traffic into guaranteed B2B buyer meetings.
Frequently Asked Questions
Why is a 30-day attribution window incorrect for wine trade shows?
International wine sales require multi-month regulatory, logistical, and commercial approvals. Importers must review sample tasting feedback, register labels with customs authorities, structure financing, and negotiate exclusivity. A 180-to-360-day attribution window provides an accurate assessment of actual closed revenue.
What is the difference between ROI and ROO for wine exhibitions?
ROI (Return on Investment) measures direct financial returns relative to total expenditure. ROO (Return on Objectives) evaluates qualitative milestones essential for market entry, including distributor price testing, brand awareness among sommeliers, competitor intelligence, and regulatory partnerships.
How should wineries account for sample bottles poured during a trade fair?
Poured wine should be recorded under the total cost of exhibition as inventory written down at production cost or wholesale transfer price, combined with the cost of shipping, duty stamps, customs clearance, and refrigerated freight.
What metric best indicates trade show lead quality for beverage brands?
Cost Per Qualified Lead (CPQL) is far superior to total badge scans. A qualified lead represents a licensed importer, distributor, or enterprise retailer with the commercial authority, import licensing, and cold-chain capacity to purchase container loads.
How can wineries reduce the risk of low trade show returns?
Wineries can mitigate performance risk by utilizing organized business matching services before the exhibition starts. Pre-scheduling one-on-one tastings with verified, active wine buyers ensures guaranteed commercial dialogue throughout the show.